
This article is for informational purposes only and does not constitute financial or investment advice. Always consult a qualified real estate professional before making any purchasing decisions.
A recent discussion around a previous analysis of the 2026 housing market raised a question worth exploring in depth: how much of what is happening in U.S. housing right now is simply the unwinding of policies and conditions that should never have been treated as normal in the first place?
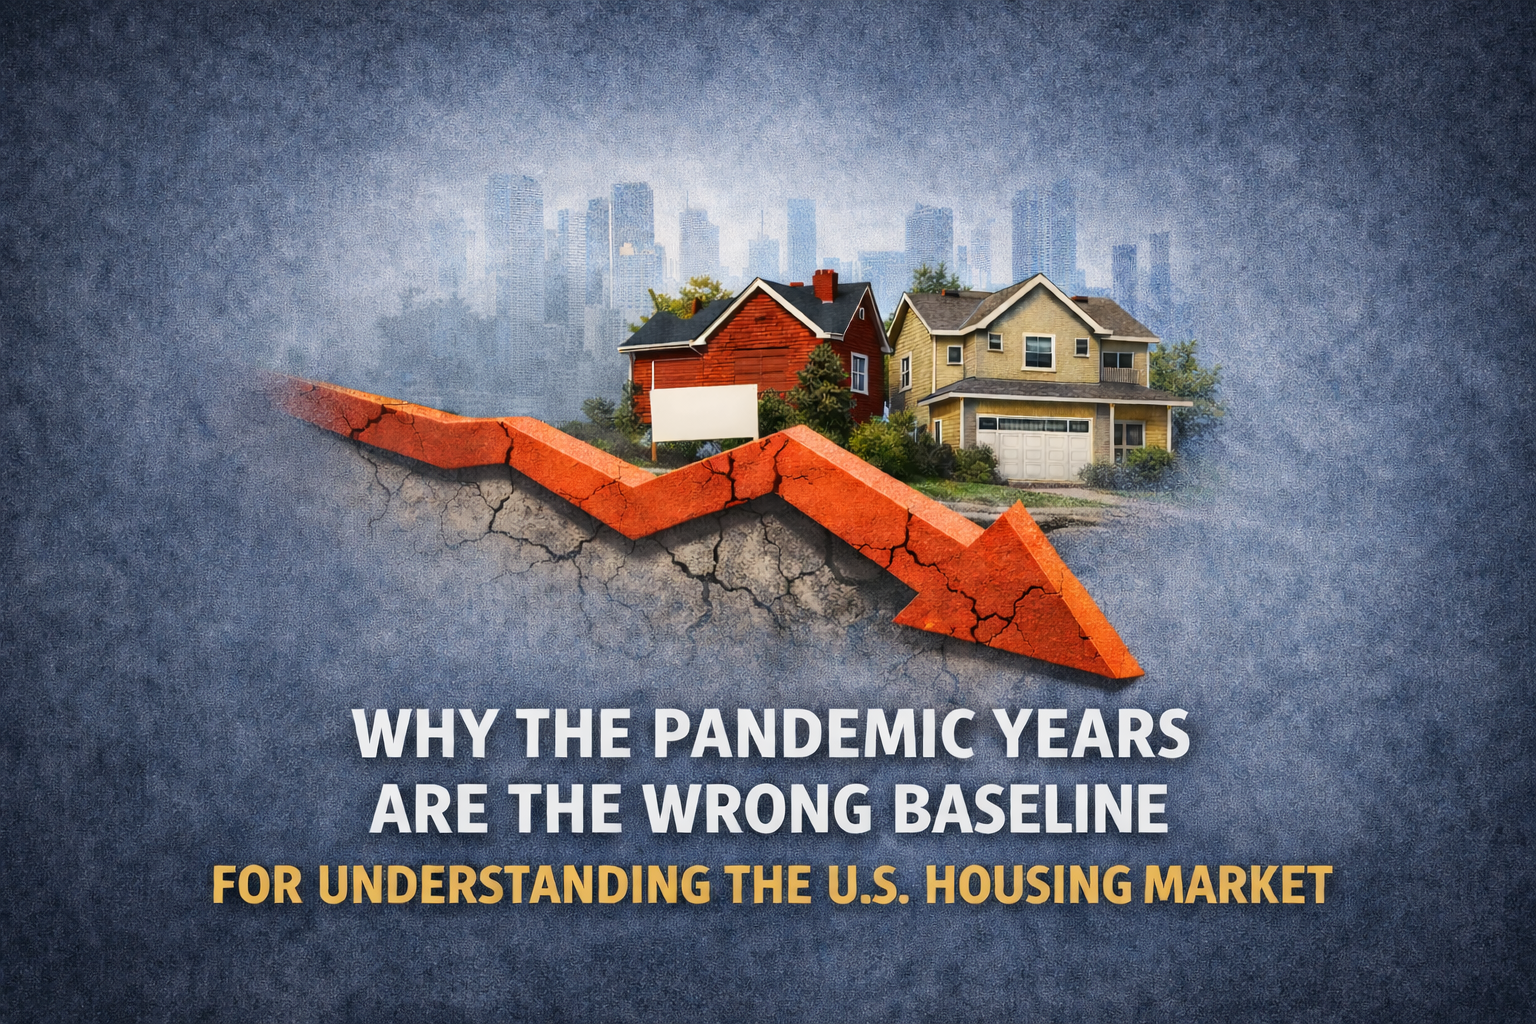
It is a fair question — and the answer, supported by the data, actually reinforces rather than contradicts the core thesis of that earlier piece. The pandemic years of 2020 to 2022 were not a normal housing market. They were the product of emergency monetary policy, unprecedented fiscal stimulus, and a once-in-a-generation shift in how and where people worked. Using those years as the measuring stick for today’s market produces conclusions that are potentially misleading for buyers and investors making long-term decisions.
Understanding where the housing market actually stands in 2026 requires stepping back from the pandemic lens entirely.
What Made the Pandemic Housing Market Extraordinary
In March 2020, the Federal Reserve cut the federal funds rate to near zero in response to the economic shock of COVID-19. According to the Federal Reserve Bank of St. Louis, the effective federal funds rate fell to approximately 0.05% — matching the near-zero interest rate environment previously implemented after the 2008 financial crisis, and representing one of only two instances of rates at this level in modern U.S. monetary history. (Source: Federal Reserve Economic Data — Effective Federal Funds Rate: https://fred.stlouisfed.org/series/FEDFUNDS)
At the same time, Freddie Mac’s Primary Mortgage Market Survey recorded 30-year fixed mortgage rates falling to approximately 2.65% in January 2021 — the lowest level since the survey began in 1971. (Source: Freddie Mac Primary Mortgage Market Survey: https://www.freddiemac.com/pmms)
The effect on housing purchasing power was immediate and dramatic. A $400,000 mortgage at 3% carries a monthly payment of approximately $1,686. The same mortgage at 7% costs approximately $2,661 per month — a 58% increase for the same loan amount. When purchasing power expands that dramatically and housing supply is already constrained, prices respond accordingly.
According to the S&P CoreLogic Case-Shiller U.S. National Home Price Index, national home prices rose roughly 43% between early 2020 and mid-2022 — one of the fastest price expansions in the modern history of U.S. residential real estate. (Source: Federal Reserve Bank of St. Louis — Case-Shiller National Home Price Index: https://fred.stlouisfed.org/series/CSUSHPISA)
But low rates were only one part of the equation. Remote work eliminated the geographic constraints that had previously anchored housing demand to employment centers. Millions of households relocated from dense urban cores to suburban and Sun Belt markets — not primarily because of low mortgage rates, but because the relationship between where people lived and where they worked had fundamentally changed. Fiscal stimulus transferred trillions of dollars into household balance sheets, supporting down payments and reducing the financial anxiety that typically suppresses housing demand during economic uncertainty.
The result was a demand environment with no meaningful historical precedent — and prices that reflected that extraordinary, unrepeatable set of conditions.
A Decade of Underbuilding Made It Worse
The pandemic demand surge did not arrive into a healthy, well-supplied housing market. It collided with a supply base that had been structurally depleted for more than a decade.
Following the 2008 financial crisis, residential construction in the United States collapsed. According to U.S. Census data, annual housing starts fell from approximately 2.07 million units in 2005 to roughly 554,000 units in 2011 — a decline of nearly 75%. The construction industry shed hundreds of thousands of workers, many of whom never returned. Lenders tightened dramatically. Developers pulled back. (Source: Federal Reserve Bank of St. Louis — Housing Starts: https://fred.stlouisfed.org/series/HOUST)
By the time the pandemic arrived, the United States had accumulated a structural housing shortage estimated at approximately 3.8 million units — the compounded result of a decade of building far below the pace required to keep up with household formation. (Source: Freddie Mac Housing Supply Report: https://www.freddiemac.com/research/insight/20210507-housing-supply)
When pandemic-era demand surged, it encountered this depleted supply base. The combination of record purchasing power and record supply shortage produced the price acceleration the Case-Shiller data documents. This matters because it explains why the correction back toward equilibrium is more complex than simply reversing the rate shock. The supply shortage did not disappear when rates normalized. It continues to provide a floor beneath prices even as affordability pressure pushes downward.
Migration Patterns Amplified the Boom — and Their Slowdown Is Now Weighing on Demand
One additional force that shaped the pandemic housing surge — and whose reversal is now contributing to the demand slowdown — is migration.
Between 2020 and 2022, Americans relocated at historically unusual rates. U.S. Census Bureau data shows that domestic migration patterns during those years were among the most pronounced in recent decades, with significant inbound population movement recorded in states such as Texas, Florida, and Arizona. Remote work flexibility allowed households to chase lower costs of living, warmer climates, and more space — and they did so in numbers that overwhelmed the receiving markets’ housing supply. (Source: U.S. Census Bureau — Migration Data: https://www.census.gov/topics/population/migration.html)
That migration wave has since slowed substantially from pandemic-era highs. As remote work patterns stabilized and housing costs in Sun Belt markets rose sharply, the affordability advantage that drove relocation eroded. The higher-income relocating buyers who had been arriving with substantial equity from higher-cost markets — and paying above local norms — are no longer present in the numbers that Sun Belt housing markets became dependent on. Local buyer pools, constrained by local incomes, must now carry those markets on their own. In many cases, local incomes are not sufficient to support current price levels.
Why Today Is Not 2008
Any analysis of a housing correction inevitably invites the question: is this 2008 again? The answer, supported by the structural evidence, is that today’s market does not display those structural characteristics at anything close to the scale seen during 2005 to 2008.
The Financial Crisis Inquiry Commission, established by Congress to investigate the causes of the 2007 to 2010 financial collapse, concluded in its 2011 report that the primary drivers were subprime lending, adjustable-rate mortgage resets, the securitization of poorly underwritten mortgages, and excessive leverage throughout the financial system. The crisis was fundamentally a credit quality crisis — millions of mortgages were originated with fraudulent or negligently assessed documentation, packaged into securities that obscured the underlying risk, and sold to investors who did not understand what they owned. When those mortgages began defaulting, the entire financial architecture built on top of them collapsed. (Source: Financial Crisis Inquiry Commission Report, 2011: https://www.govinfo.gov/content/pkg/GPO-FCIC/pdf/GPO-FCIC.pdf)
The current housing market does not display those structural characteristics at anything close to that scale. Mortgage origination standards today are materially tighter than they were in 2005 or 2006. Average credit scores on new mortgage originations have risen significantly from pre-crisis levels. Fixed-rate mortgages dominate the market, eliminating the payment shock risk that triggered mass defaults when adjustable rates reset in 2007 and 2008. Mortgage delinquency rates, while worth monitoring, remain far below the levels that preceded the 2008 collapse.
What is happening in 2026 is a different kind of correction. It is an affordability-driven correction — prices that overshot sustainable income-based valuations during an extraordinary demand surge are gradually mean-reverting. That process is slow, uneven, and in many markets still incomplete. But it does not carry the systemic financial risk that defined 2008.
The Affordability Math That Actually Matters
As detailed in the previous analysis of the 2026 housing market, the core problem driving today’s low transaction volumes is arithmetic rather than sentiment.
The National Association of Realtors Housing Affordability Index — which measures whether a median-income household can qualify for a mortgage on a median-priced home — has fallen to some of its lowest levels since the 1980s, reflecting a housing payment burden that now consumes roughly one-third or more of gross household income in many markets. Housing economists have historically used 28 to 30% of gross income as the threshold for sustainable mortgage payments. The current environment sits well above that threshold in a significant portion of U.S. markets. (Source: NAR Housing Affordability Index: https://www.nar.realtor/research-and-statistics/housing-statistics/housing-affordability-index)
Existing home sales, which peaked near 6.1 million units at an annual pace in 2021, fell to approximately 4.0 to 4.1 million by 2024 to 2025 — a roughly 35% decline in transaction volume that directly reflects the size of the buyer pool that has been priced out of participation. (Source: NAR Existing Home Sales: https://www.nar.realtor/research-and-statistics/housing-statistics/existing-home-sales)
These numbers are not a post-pandemic normalization. They are the consequence of a specific sequence: prices rose roughly 43% during an extraordinary demand surge, mortgage rates then normalized from emergency lows to levels reflecting the actual cost of capital, and the monthly payment burden that resulted exceeded what median household income can sustainably support in many markets.
The Price-to-Income Ratio: The Most Honest Measure of Housing Value
Of all the metrics used to evaluate housing market conditions, the price-to-income ratio — comparing home prices to local household incomes against their long-run historical averages — is the one that strips away the most noise and cuts closest to what sustainable value actually looks like.
Historically in the United States, the ratio of median home prices to median household incomes has typically ranged roughly between 3.5 and 4.0, though regional variation is common. That range reflects the long-run relationship between what homes cost and what the households who live in them actually earn, measured across multiple economic cycles.
Research from the Federal Reserve Bank of Dallas documented how dramatically this ratio deviated during the pandemic boom, with many U.S. markets reaching price-to-income ratios well above historical norms during the 2021 to 2022 peak. (Source: Federal Reserve Bank of Dallas Housing Overvaluation Analysis: https://www.dallasfed.org/research/economics/2022/0329)
Markets where that ratio has since compressed back toward its long-run average are the markets closest to genuine equilibrium. Markets that saw the largest pandemic-era price surges — including parts of Texas, Florida, Arizona, and Colorado — and have since corrected most aggressively are closest to income-based fair value. Markets that experienced significant overvaluation but have barely corrected still carry meaningful residual downside risk, not because their underlying economies are weak, but because their prices remain above what local income levels can sustainably support.
The correction pressure in any given market is best measured by the distance between its current price-to-income ratio and its long-run historical norm — not by the distance from a pandemic peak that was itself the product of extraordinary distortion.
Why Using the Pandemic Peak as a Reference Point Distorts Everything
When analysts describe today’s buyer demand as having declined sharply relative to pandemic levels, or today’s prices as being down from peak, they are implicitly treating the pandemic peak as a normal reference point. It is not.
Demand during the pandemic years was the outlier — inflated by a combination of forces explicitly designed to be temporary. The more accurate framing is that demand has returned toward its long-run structural level, and that level is insufficient to support prices that were set during the peak of the distortion.
A home that sold for $550,000 in 2022 and is now listed at $480,000 is not necessarily reasonably priced simply because it represents a discount to peak. The relevant question is whether $480,000 is supportable by local income levels, local rental market comparables, and long-term demand fundamentals — not whether it represents a reduction from a price set during emergency monetary conditions.
The pre-pandemic period of roughly 2017 to 2019 provides a more honest baseline. In markets where current prices remain materially above their 2018 to 2019 levels on an inflation-adjusted basis, and where local income growth has not closed that gap, residual correction pressure exists regardless of what interest rates do in the near term.
The Lock-In Effect: Why the Correction Is Moving Slowly
The majority of existing U.S. homeowners are sitting on mortgages originated between 2020 and 2022 at rates between 2.5% and 4%. Selling their current home and purchasing another at today’s rates would dramatically increase their monthly housing costs even if they bought a comparable property.
This dynamic has kept existing home supply far below what demand conditions would otherwise call for. Sellers who might have listed in a normal rate environment are staying put — which means the supply-side pressure that would ordinarily accelerate price correction is largely absent. The result is a market where transactions have collapsed, prices are declining slowly and unevenly, and the adjustment is being stretched across years rather than quarters.
There is a notable irony embedded in this dynamic. The same emergency rate environment that drove prices to unsustainable levels is now, indirectly, slowing their correction. Homeowners locked into sub-4% mortgages have a powerful financial incentive to hold, which suppresses supply, which slows price discovery, which extends the period of market dysfunction. The distortion created the problem and is now partially insulating it from its own resolution.
What This Means for Buyers and Investors
The practical framework for evaluating any real estate decision in 2026 follows directly from this analysis.
Buyers should anchor their evaluation of asking prices to local income fundamentals and long-run price-to-income norms rather than to pandemic peak prices. A discount from peak is meaningful only if the peak itself was a reasonable reference point. In many markets it was not.
Markets that corrected earliest and most aggressively are closest to income-based fair value and therefore closest to genuine stabilization. Markets that have seen minimal correction despite significant pandemic-era overvaluation carry the most residual downside risk — not because their economies are weak, but because their prices remain above what local income levels can sustainably support on a long-run basis.
For investors, the price-to-income metric is the most useful primary screening tool. Markets where the ratio has returned to or below historical norms offer the most defensible entry pricing. Markets where the ratio remains well above historical norms carry correction risk that is not fully resolved by whatever price decline has already occurred.
As the previous article documented in detail, the demand slowdown now visible across many U.S. housing markets is not a temporary dip from a sustainable high. It is the logical consequence of prices set during an extraordinary distortion meeting the mathematical reality of what local incomes can actually support.
Conclusion
The pandemic housing boom was produced by conditions unlikely to repeat in the same form — near-zero interest rates, unprecedented fiscal stimulus, a decade of prior underbuilding, and migration patterns that have since substantially reversed. The prices it generated were real transactions at real moments in time, but they were not a reliable indicator of sustainable value.
Today’s housing market is best understood as a market in gradual correction from an extraordinary distortion — not a market in decline from a normal peak. The correction does not carry the systemic financial risk of 2008. It is an affordability correction, moving slowly because the lock-in effect is suppressing the supply-side pressure that would otherwise accelerate it, and because a decade of underbuilding has left a structural supply floor beneath prices even in weakening markets.
The baseline you choose determines the story you tell. Choose the pandemic peak and today’s market looks like a modest pullback. Choose long-run income fundamentals and a different picture emerges — one of a market still working through the consequences of one of the most extraordinary demand distortions in modern real estate history, unevenly and market by market, toward a level that local economies can actually sustain.
Data Sources Referenced in This Article
- Federal Reserve Effective Federal Funds Rate: https://fred.stlouisfed.org/series/FEDFUNDS
- Freddie Mac Primary Mortgage Market Survey: https://www.freddiemac.com/pmms
- Case-Shiller National Home Price Index: https://fred.stlouisfed.org/series/CSUSHPISA
- U.S. Housing Starts: https://fred.stlouisfed.org/series/HOUST
- Freddie Mac Housing Supply Report: https://www.freddiemac.com/research/insight/20210507-housing-supply
- NAR Housing Affordability Index: https://www.nar.realtor/research-and-statistics/housing-statistics/housing-affordability-index
- NAR Existing Home Sales: https://www.nar.realtor/research-and-statistics/housing-statistics/existing-home-sales
- U.S. Census Migration Data: https://www.census.gov/topics/population/migration.html
- Federal Reserve Bank of Dallas Housing Analysis: https://www.dallasfed.org/research/economics/2022/0329
- Financial Crisis Inquiry Commission Report: https://www.govinfo.gov/content/pkg/GPO-FCIC/pdf/GPO-FCIC.pdf